Nailing the right exposure can make a tremendous improvement in the quality and flexibility of digital footage. However, this also requires carefully balancing several potentially competing factors. In this article, we'll discuss how to use the in-camera histogram tools to achieve the right balance.
BACKGROUND
In a nutshell, an optimal exposure records enough light to minimize noise, but not so much that important highlights have the potential to become clipped (see exposure strategy with RED cameras). The key is to be able to quickly assess whether the exposure goals are being achieved. With RED®, several in-camera tools are available for both exposure and the appearance of on-screen previews.
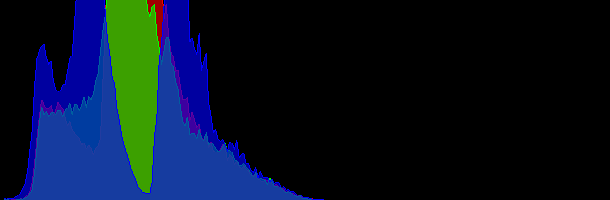
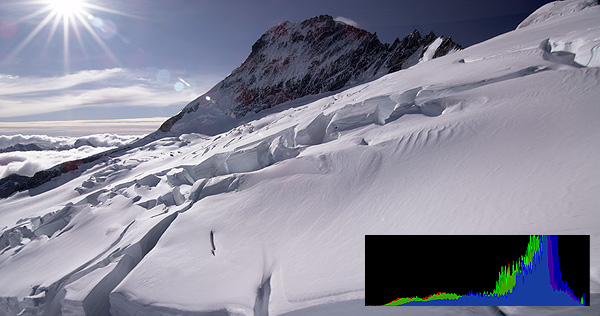
The first important tool is the histogram, which is displayed in real-time on the bottom left of the LCD preview screen. A histogram depicts the relative fraction of an image (vertically) that comprises each tonal level (horizontally). Farther to the left represents deeper shadows, and similarly, farther right represents brighter highlights:
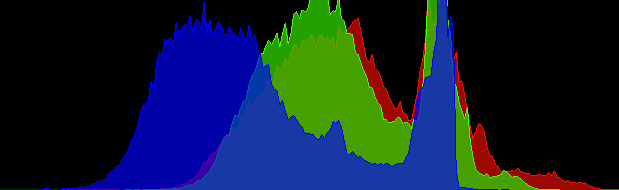
RED cameras show separate overlaid histograms for each of the red, green and blue color channels. All three histograms are useful for assessing clipping risk in those channels, but the green histogram can also give a rough approximation of overall image brightness. In general though, RGB histograms only truly represent brightness when all three histograms correspond; as specific regions of these histograms diverge, the more saturated and colorful those tones will often appear, and the less those regions of the histogram will represent brightness.
HISTOGRAM & TONES
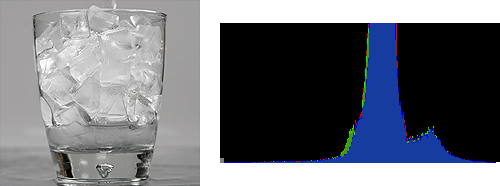
Images usually appear correct whenever the tonal distribution within the histogram reflects the tones which are perceived in the scene. For standard scenes with a predominance of midtones, this usually means the histogram will have a "mountain in the middle" with a decline toward the sides. If the histogram piles up toward the left or right, the image will often appear too dark or bright.
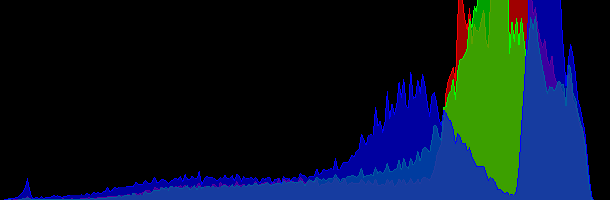
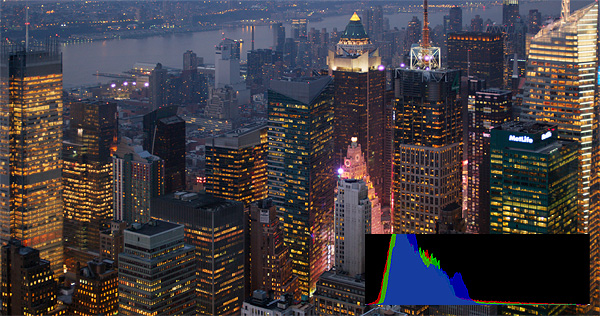
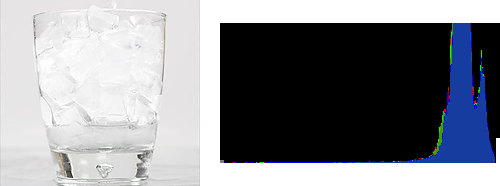
However, always aiming for a central histogram would be a mistake, especially with high and low-key scenes. For example, a central histogram would cause a snow scene and a nighttime cityscape to appear too dark and bright, respectively. In other words, histograms cannot be treated as the equivalent of a digital light meter since they represent reflected, not incident light.
Regardless, the key is that histograms alone don’t indicate proper exposure—just how the on-screen preview will appear using the current ISO and look settings. An optimal exposure could easily have a sub-optimal histogram, and vice versa. Trying to achieve a central histogram at the lowest ISO speed could still lead to overexposure, for example—even if the on-screen preview appears correct—because highlight clipping will become much more likely.
GOAL POSTS
In order to quickly balance the competing trade-offs of noise and highlight protection, RED cameras also have indicators at the far left and right of their histogram. Unlike the histogram though, these are not affected by ISO or look settings, and instead represent raw image data. The indicators are depicted as vertical bars to each side of the histogram, and are often referred to as the "goal posts," since the aim is usually to achieve a histogram which doesn't adversely hit either side.
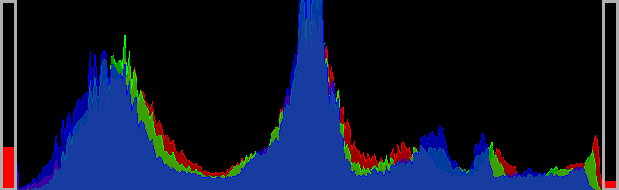
The height of each goal post reflects the fraction of overall pixels that have become either clipped (on the right), or near the capabilities of the camera to discern real texture from noise (on the left). The full scale for each goal post represents a quarter of all image pixels. In general, the left goal post can be pushed up to about 50% height and still give acceptable noise, but even a small amount on the right goal post can be unacceptable, depending on where this clipping appears in the image.

TRAFFIC LIGHTS
Sometimes the goal posts alone don't provide enough information about how an image is clipped. RED cameras therefore also indicate which color channels have become clipped (to the right of the histogram). These indicators appear as a red, green and blue dot for each color channel, and are therefore often referred to as the "traffic lights."

When about 2% of the image pixels for a particular color channel have become clipped, the corresponding traffic light will turn on. This can be particularly helpful in situations where just the red channel has become clipped within a skin tone, for example. In that case, the right goal post would be much lower than it would appear otherwise, since all three channels haven't become clipped.
DISCUSSION
Some advocate a strategy called "expose to the right" (ETTR), whose central principle is to record as much light as possible without clipping, causing the histogram to appear shifted to the far right. While this approach works well with stills photography, it greatly increases the likelihood of clipped highlights with video footage, since lighting conditions are often more dynamic.
Furthermore, ETTR can be misleading since the live histogram doesn't represent raw image data. An ETTR strategy that doesn't also pay attention to the goal posts therefore runs a high risk of overexposure and increasingly so at lower ISO settings. Instead of recording as much light as possible, we instead encourage only recording as much light as necessary to meet one's goals for image noise, but not necessarily any more than that, all while paying attention to the goal posts, traffic lights, and the histogram.
RELATED TOPICS
- Also see part 1 of this tutorial: Exposure with RED Cameras: Strategy.
- Also see part 3 of this tutorial: Exposure with RED Cameras: False Color & Zebra Tools.